


Imaging techniques used in staging and evaluation of response to treatment have improved dramatically over the past 120 years. The issue going forward will be learning to combine anatomical and functional imaging modalities to get a picture that is as close to the truth as possible.
 This e-grandround charts the evolution of pioneering imaging techniques. It describes their clinical applications in two tumour types – breast cancer and lymphoma – and the impact they have had on the management of patients with these cancers, and looks ahead to cancer imaging aspects of the future.
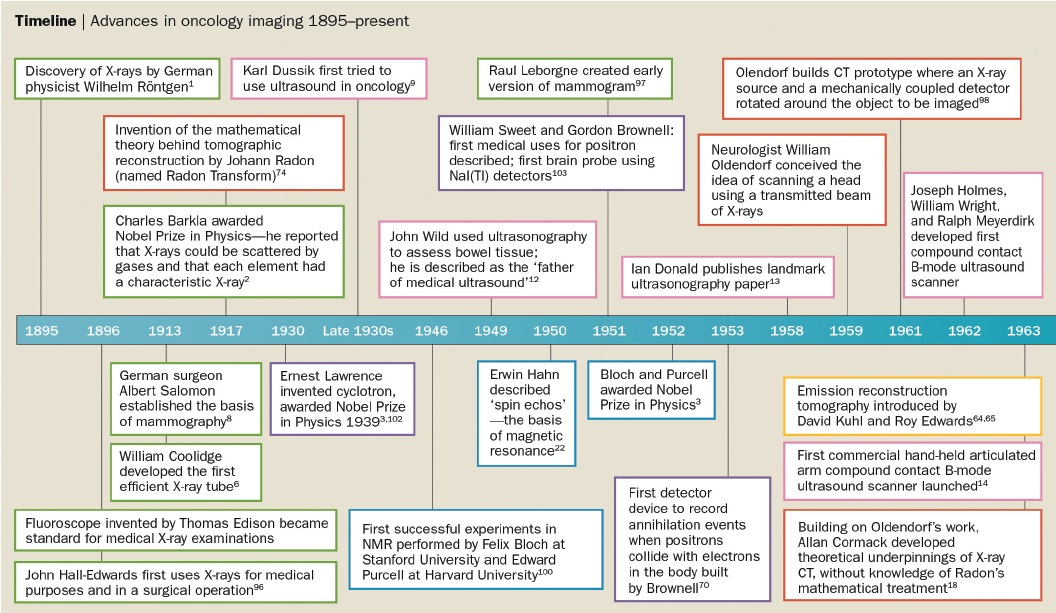
The timeline showing the development of different imaging techniques over the last 120 years is shown overleaf, together with information on the key individuals involved in their design. A recurring theme is that the work leading to the development of most imaging modalities took place over many years, even decades, before the eventual invention. In addition, a large number of people from a wide range of disciplines, including chemists, physicists, mathematicians, biologists and electrical engineers as well as physicians, were involved in these inventions.
X-rays
X-rays were discovered in 1895 by the German physicist Wilhelm Conrad Röntgen, who coined the term ‘radiation X’ for this previously unknown type of radiation. He resisted suggestions from colleagues to use the term ‘Röntgen rays’ but this is sometimes used in some countries, including Germany. Röntgen was awarded the first Nobel Prize in Physics in 1901 for his discovery.
The advantages of X-rays are that they are rapidly acquirable and easily reproducible. Disadvantages include exposing the patient to radiation and providing only limited oncological information. Over the last 100 years or so, X-ray imaging has been largely superseded by other oncological imaging techniques for a range of different indications, but it remains an important technique to look for complications in cancer patients. Use of X-rays remains a mainstay in certain areas of oncological imaging, including mammography. This technique was first discovered by the German surgeon Albert Salomon in 1913, who observed the different appearance of tumour tissue compared to benign tissue in mastectomy samples. It remains a very useful technique, particularly for screening patients with fatty breasts and to look for microcalcification.
Computed tomography
A British electrical engineer, Godfrey Hounsfield, is credited with being the inventor of CT in 1971. As with many other types of oncological imaging, significant work predated this particular invention. Allan Cormack, a South African physicist, described the fundamental mathematical physics of CT in 1963, but Hounsfield was unaware of his work. Even earlier, the basic mathematics underlying CT was described by Johann Radon in 1917, becoming known as the Radon transform, but Cormack and Hounsfield were both unaware of Radon’s work. Subsequently, both Hounsfield and Cormack were recognised for the discovery of CT, and awarded the Nobel Prize in Physiology or Medicine in 1979.
CT is a fundamentally important technique in oncological imaging and has had huge impact. It remains the ‘workhorse’ modality in oncological imaging units across the world. Key advances in CT technology include the advent of helical CT in 1987 with multi-detector CT in 1998.
An example of the way CT has changed clinical practice can be seen in lymphoma. Before CT, chest X-ray and lymphography were the main techniques used for patient workup. Chest X-ray was used to look for mediastinal nodal involvement and lymphography was the crude technique involving injection of dye into the web space in the feet to visualise involved lymph nodes. Staging laparotomy was performed with splenectomy on patients to define whether the spleen was involved. CT changed all this by providing a whole-body imaging technique, which avoided the need for laparotomy and enabled imaging of the entire body to look for enlarged lymph nodes and extranodal sites of involvement.
CT has also been very important in allowing the development of image-guided radiotherapy, and the development of response evaluation criteria is allied with the development of CT. The principal disadvantage of CT is the radiation dose, in addition to some clinical limitations discussed later.
Magnetic resonance imaging
Many individuals were involved in the development of MRI. Erwin Hahn described ‘spin echoes’ in the 1950s, for which he was subsequently awarded the Wolf Prize in physics. In the 1970s, Raymond Damadian reported that nuclear magnetic resonance can distinguish cancer from normal tissue in vivo, and the American chemist Paul Lauterbur produced the first MRI image of a mouse in 1974. Damadian went on to perform the first human MRI scan in 1977. British physicist Peter Mansfield was responsible for developing the mathematical techniques leading to faster and clearer MRI imaging in 1977. Lauterbur and Mansfield were both awarded the Nobel Prize in Physiology or Medicine for their discoveries concerning MRI in 2003 but, controversially, Damadian was not recognised for his contribution.
The advantages of MRI include the absence of radiation exposure; the technique provides good contrast resolution and has the ability to provide multiplanar imaging. Limitations include the fact that patients with metallic prostheses may not be suitable for scanning, and claustrophobia is a significant problem for patients in clinical practice. Nevertheless, MRI quickly gained clinical ground, having been invented from the outset as an oncological imaging technique. It was rapidly taken up for imaging of the central nervous system, particularly for brain tumour. There has also been considerable interest in MRI as a whole-body imaging technique.
Positron emission tomography
For many years we have used anatomical techniques in oncological imaging, looking for anatomical changes. However, in recent years interest has been growing in the use of functional imaging. Key individuals involved in the development of PET included Gordon Brownell at the Massachusetts General Hospital in the 1950s and 1960s, and work from the Brookhaven National Institute in America in the 1960s. Michael Phelps, Michel Terced the first PET instrument in 1973, which enabled transaxial PET images to be obtained.
PET is a functional technique that relies on the injection of a radioisotope, which is linked to a biologically active molecule that targets the site of interest in the body. The clinical tracer that has been in use for several decades is 18-fluorodeoxyglucose (FDG), discovered by Wolf and Fowler in 1978, which is comprised of glucose linked to a radioligand. The initial interest in PET was for neurological imaging, but in the late 1980s the focus moved to cardiac viability, looking at cardiac perfusion and hibernating myocardium. PET was found to be very useful in oncological imaging almost by chance, with the first oncological PET image being presented in 1991, using FDG as a radiotracer. To this day oncological imaging is by far the major use of PET in worldwide clinical practice.
The advantages of PET include the capacity for whole-body imaging, lesion characterisation and accurate staging. Functional imaging provides an early response assessment in the sense that functional changes ‘predate and predict’ anatomical changes, so early response to a variety of treatments can be evaluated using functional techniques. Limitations include the drawback that FDG is not accurate across all tumour histologies and that tissue changes such as inflammation will also take up FDG, so it is not a truly tumour-specific ligand. The other key disadvantage of PET is that, unlike MRI, it involves a radiation dose.
PET has made a stepwise change to clinical practice in lymphoma and a number of other tumour types, in a similar way to CT. In Hodgkin lymphoma and high-grade lymphomas, PET leads to clinically significant stage migration at baseline staging (i.e. it picks up disease not detected by other imaging modalities, which has an impact on the proposed treatment). It provides information for early response evaluation and in residual mass assessment, as to whether viable disease is still present or whether the residual mass reflects inactive fibrosis. PET-CT, which was originally envisaged by Townsend and Nutt in 1991, was invented in 1999, and led to a huge change in the use of PET across clinical practice, and widespread acceptance in the clinical community, by combining anatomical with functional information and enabling lesions to be precisely localised.
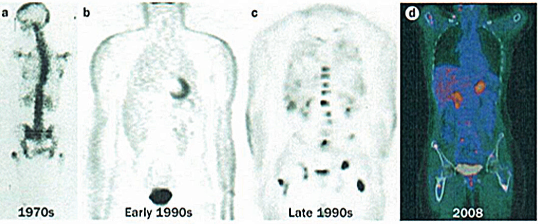
The figure below illustrates the evolution of PET since the 1970s, with the first image demonstrating a crude PET image from the 1970s through to the PET images that were produced in the early and late ’90s, and then the stepwise further change with PET-CT in the last decade, leading to much more accurate anatomical localisation of sites of uptake.
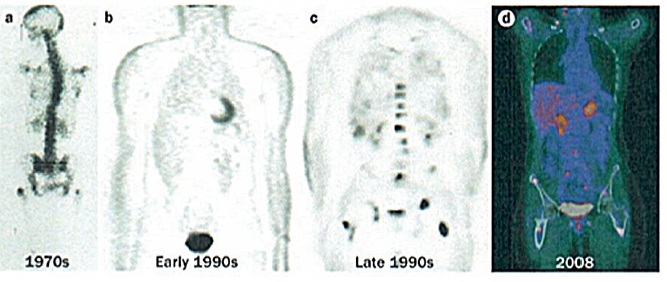 Four images demonstrating how the resolution and accuracy of lesion detection by PET imaging has increased over the past four decades.
a) 1970s rectilinear 18F-fluouride scan – the pioneering rectilinear scanning technique had been developed by Brownell and co-workers in 1953
b) Non-attenuation-corrected whole-body PET imaging in the early 1990s, using filtered back projection rather than iterative reconstruction
c) Attenuation-corrected (BGO crystal detector) FDG PET image from the late 1990s of a patient with breast cancer. A number of scattered sites of increased FDG accumulation are observed, most clearly within the thoracolumbar spine and bony pelvis region bilaterally, representing metastases; of note, defining the exact anatomical location of lesions in this image is almost impossible
d) PET-CT image of a patient with high-grade lymphoma taken in 2008, leading to stage migration, with PET-CT detecting occult scattered focal bone sites of involvement in addition to known lymphadenopathy
The figure below, right illustrates some of the strengths and weaknesses of imaging science with PETCT in images from a patient with breast cancer. Bone staging and response evaluation are real problems in oncological imaging. On anatomical imaging (CT and MRI), ‘increasing dense sclerosis’ is one feature of bone response to treatment in a number of different tumour types/situations. However, in a proportion of oncology patients a point is reached where ‘stable dense sclerosis’ is present on CT/MRI, and it is not possible to assess bone disease activity/ control. Functional imaging with PET can be very useful in a proportion of tumour histologies.
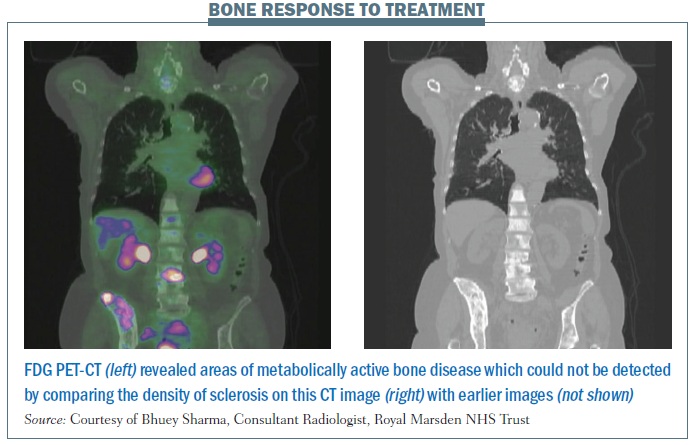 The coronal CT images shown (on the right of the figure) demonstrate diffuse heterogeneous sclerosis throughout the axial and proximal appendicular skeleton imaged, which is stable compared with the previous scan (not shown). The colour-fused PET-CT image (on the left) shows that the vast majority of the bone infiltration in this patient with invasive ductal breast cancer is not FDG avid, representing a current complete macroscopic metabolic response to systemic treatment. Abnormal 18FDG PET activity is shown only at L3 and the superior right ilium, reflecting sites of metabolically active bone disease. The PET findings implied that an ongoing maintenance (hormonal) treatment approach was suitable in this patient rather than re-institution of systemic cytotoxic chemotherapy.
This was the subject of a large retrospective study of PET-CT in breast cancer, illustrating our philosophy regarding the importance of multiparametric imaging for the optimal management of cancer patients (Ann Oncol 2011; 22:307–314).
Looking to the future
In terms of future directions, new techniques such as PET-MRI, which comprises a fusion of functional imaging and anatomical imaging, the use of novel targeted PET radio tracers, and the use of whole-body diffusion- weighted imaging are likely to make an important contribution. However, imaging history in oncology teaches us that no single technique is accurate across all tumour types, and in answering all specific tumour questions. Although these new techniques will likely come to the fore, each of them will have strengths and weaknesses and will not provide the universal answer to all of the problems that we have in caring for cancer patients.
There are six fundamental hallmarks of cancer and these can be targeted in a specific way with radiotracers. Although we have been using FDG so far for the vast majority of clinical PET, more specific radiotracers are increasingly being developed, with a number entering the clinical domain. As we develop radiotracers targeted towards specific cell receptors and specific tumour receptors, then PET-CT and PET-MRI will become much more accurate.
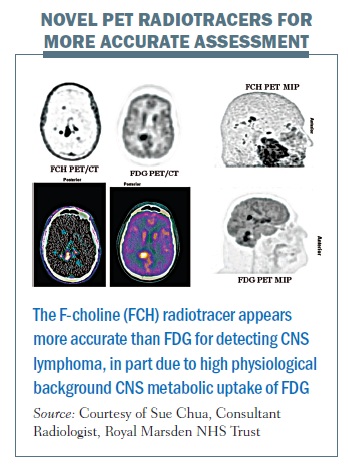
The figure below illustrates the concept of using targeted imaging to provide a more accurate assessment of a patient’s oncological status. The FDG PET images (middle column and bottom right; inverse grey scale, colour fused and maximum intensity projection images respectively) demonstrate sites of increased metabolic activity in the right posterior cerebral and cerebellar hemispheres in a patient with high-grade lymphoma with involvement of the central nervous system (CNS). Note high physiological background CNS uptake on FDG PET imaging. The F-choline (novel radiotracer) PET imaging (left column and top right) demonstrates significantly higher accuracy than FDG PET for the detection of CNS lymphoma, revealing multifocal CNS lymphoma (which was concordant with IV contrast-enhanced MRI, images not shown). F-choline is a specific substrate for choline kinase,an enzyme commonly overexpressed in malignant lesions due to its role in cell membrane synthesis. It is therefore a measure of cellular proliferation rather than metabolic rate. To date, choline has found its most important PET application with prostate cancer, where FDG is not generally useful, as prostate cancers can have relatively low metabolic rates. Early work suggests that F-choline may be useful in the context of CNS lymphoma (one area of our current research).
 Diffusion-weighted imaging MRI is also likely to be important in oncological imaging in the coming years. The technique is being validated across a number of different tumour types in research, but shows significant promise and is increasingly being used in oncology for brain and liver imaging. It also shows exciting promise for staging and response evaluation in bone marrow and in other problem areas such as assessment of peritoneal disease and brachial plexopathy. The concept of diffusion-weighted MRI relies on the difference in water movement in different tissues, with restricted water movement in areas of high cellularity contrasting with less restricted water diffusion in areas where tumour has been broken down to a less cellular structure. It is an MRI technique that provides whole-body imaging with no radiation exposure. Data can be quantified with the apparent diffusion coefficient (ADC), providing an objective measure of tumour response (with PET, semi-quantitative analysis can be performed using the standard uptake value, or SUV).
The figure below illustrates the limitations of CT scans (left-hand images), in terms of sclerotic bone response evaluation. The top image shows widespread bone disease and the liver image demonstrates a few liver metastases. After the phase I drug, the images at the bottom suggest bone disease is stable with no discernable differences on CT imaging; however, based on these images it is really impossible to define whether the patient is responding in the bony skeleton. The liver images demonstrate that there have been some slight changes in the liver metastases, although the liver status overall was considered stable according to the RECIST classification.
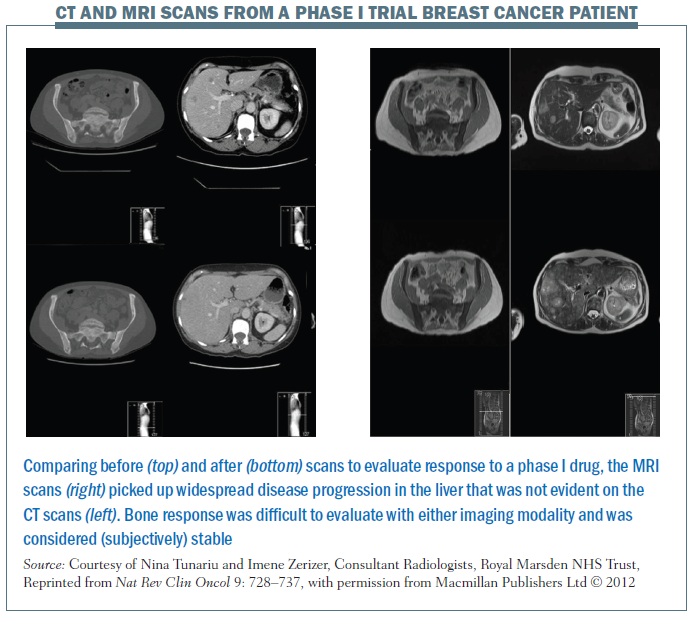 The images on the right of the same figure are T2-weighted MRI images for the same patient. The top and bottom images show that the bony sclerosis looks stable – again impossible to define whether there has been a change in the patient’s bone status. However, the liver images show marked widespread liver progression, so, in this particular case, MRI was more sensitive than CT in demonstrating liver disease progression.
However, using diffusion-weighted MRI in the same patient, at the same time points, gives a different answer (see figure below). The lefthand images at the top and bottom of the figure show that the degree of restricted diffusion has reduced. The middle images show that the apparent diffusion coefficient (ADC) values have reduced, with a shift on the ADC map, showing good bone response to treatment, which could not be defined from CT or ‘standard’ MRI. Conversely, the diffusionweighted MRI of the liver (right-hand images) demonstrates that there has been marked liver progression. This exemplifies a case of a patient who was considered to be stable on CT, while MRI demonstrated stable bone status but liver progression, and diffusion- weighted MRI demonstrated a fundamentally different result, showing that the diffuse bony infiltration has partially responded to treatment, whereas there has been marked liver progression (i.e. a true mixed response). This is an important exam ple of how these new techniques will not only change clinical practice but also change endpoints/patient stratification in research trials.